Defining Colour Spaces
The colour spaces we’re familiar with, such as sRGB, Display P3 or BT.2020, all provide xy chromaticity coordinates that are defined and used under the CIE 1931 2° colour matching functions (CMFs).
Once you switch the colour matching functions (for example to the CIE 1964 10° CMFs, or the newer CIE 2015 2° and 10° CMFs), you can no longer keep using the original chromaticity coordinates. Doing so would not only be wrong in principle, but would also produce phenomena such as a gamut extending beyond the spectral locus. As for how to determine a colour space’s chromaticity coordinates under the new matching functions, the key is to find or construct corresponding spectra to serve as a bridge connecting the different CMFs.
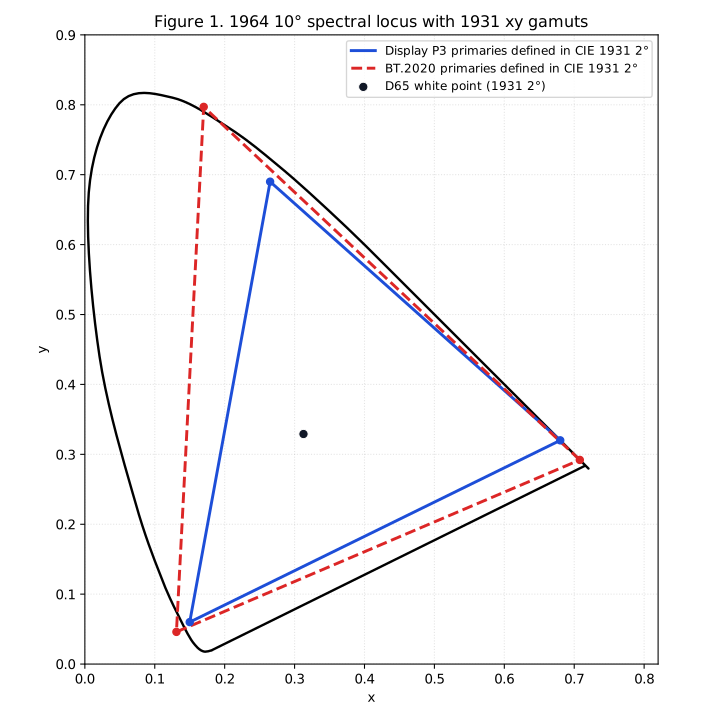
Some standards provide reference, or “informative”, spectra. For instance, BT.2020 states that the reference spectrum for the white point is the D65 standard illuminant, and the reference spectra for the three primaries are monochromatic light at 630nm, 532nm and 467nm respectively. But on the one hand, this spectrum is only “informative”—it doesn’t necessarily have to be this exact spectrum (though for BT.2020 there’s hardly any other choice). On the other hand, Display P3 and sRGB don’t explicitly provide such reference spectra, so you still need to find a way to construct them.
Finding a “Bridge” Spectrum
The problem now becomes how to find a spectrum that corresponds to a standard colour space’s chromaticity coordinates under the CIE 1931 2° CMFs, while also satisfying certain conditions, such as having low observer metamerism. This spectrum doesn’t necessarily have to be something that can actually be manufactured; it only serves as a bridge connecting different CMFs, used to calculate the chromaticity coordinates under the new CMFs.
If you only need to satisfy the chromaticity coordinates, there’s a great deal of freedom in finding such a spectrum. Here I’ll briefly introduce two strategies.
Reusing Existing Spectra
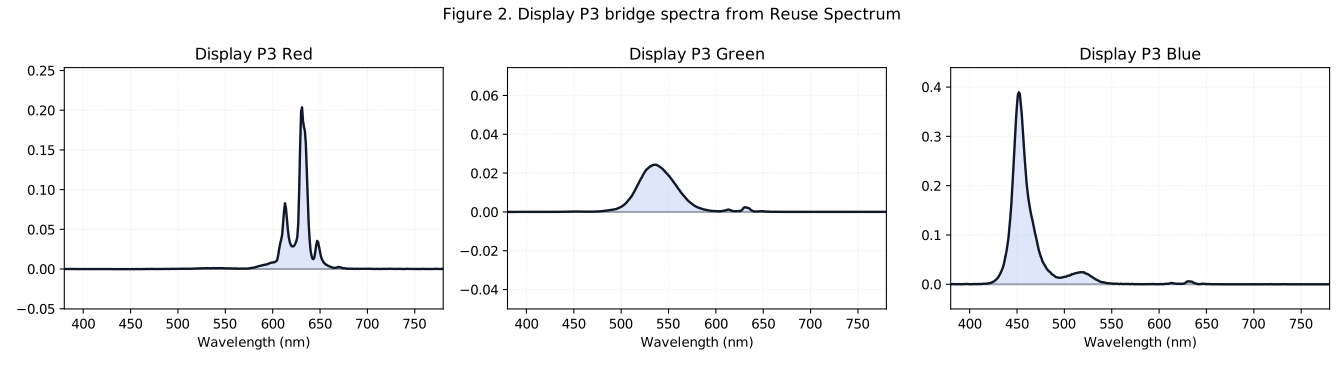
If you already have some spectra, then for the sake of “consistency” between solutions and a smoother transition, you might consider reusing them. In theory, any three spectra whose chromaticity coordinates aren’t on a single straight line will do, but the conversion results will vary depending on which spectra you choose. The figure below shows a bridge spectrum constructed from the primary spectra of a MacBook Pro 14, which corresponds to the Display P3 chromaticity coordinates under the CIE 1931 2° CMFs.
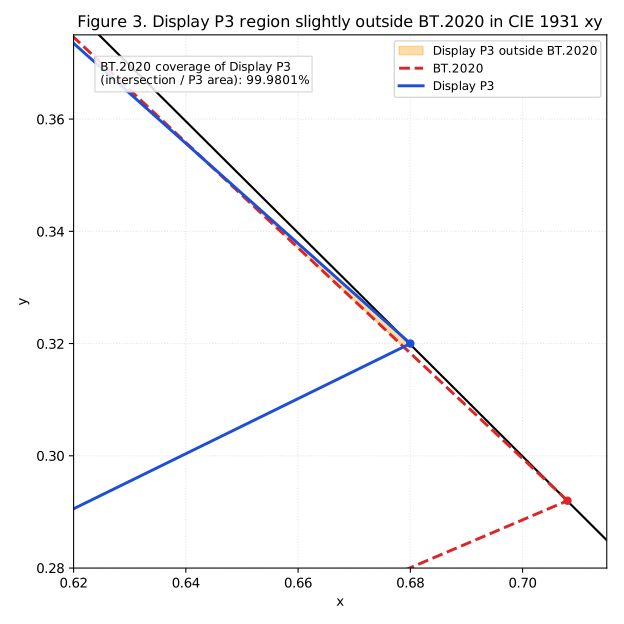
Since this bridge spectrum doesn’t need to actually be manufactured, even if the gamut formed by the chosen primary spectra is relatively small, it can still be achieved through negative-valued spectra. A classic example is BT.2020 and P3. Although BT.2020 is large, it actually can’t fully cover Display P3. P3’s red vertex is also on the spectral locus, and its reference spectrum is red light at around 615 nm. A small region near the red vertex falls outside BT.2020. On the CIE 1931 xy chromaticity diagram, you can calculate that BT.2020’s area coverage of Display P3 is 99.98%.
Square Waves
This is an approach reported by the Apple team at the CIC33 conference in 2025, using square waves to construct virtual bridge spectra.
Y. Zhu et al., “Spectral definition of standard color space primaries for display,” Color Imaging Conf., vol. 33, no. 1, pp. 142–146, Oct. 2025, doi: 10.2352/CIC.2025.33.1.27.
This is a bit like the concept of MacAdam optimal colours. In a previous blog post, I covered how to prove that the reflectance corresponding to a MacAdam optimal colour must be a square wave containing two transition points.
Put simply, a square wave containing two transition points can fully cover the entire chromaticity diagram. Apple classifies samples with one and two reflectance bands as Type 1 and Type 2. By finding the bridge spectrum within these that corresponds to the chromaticity coordinates, you can then calculate the new coordinates under another set of CMFs.
- A step function is used to represent the spectral distribution of each primary:
- Type I: 1 over a certain wavelength interval, 0 elsewhere
when , otherwise 0 - Type II: 0 over a certain wavelength interval, 1 elsewhere
when , otherwise 1
- Type I: 1 over a certain wavelength interval, 0 elsewhere
- The spectrum of each primary is determined by two parameters:
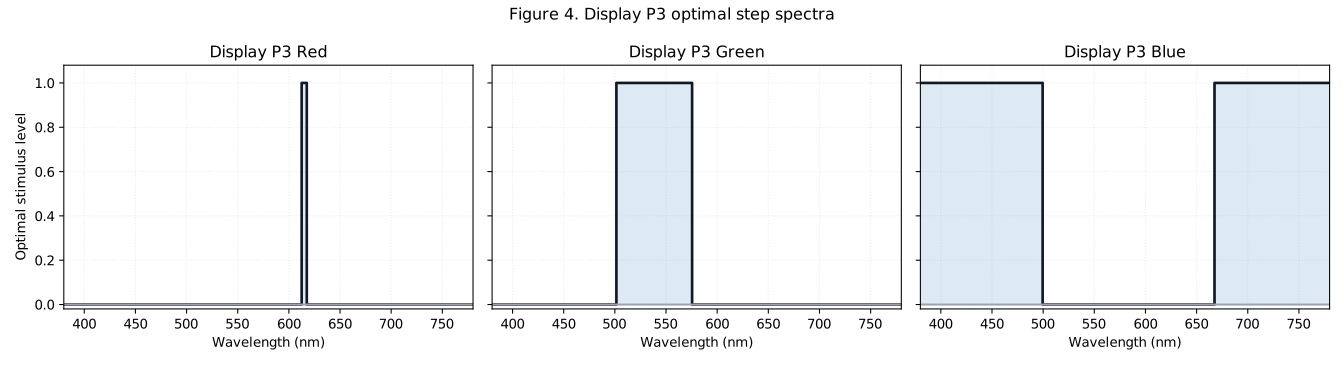
Using a bridge spectrum like this to connect different CMFs makes the colour space calculated and drawn in the new CMFs far more reasonable and scientific. If a new set of colour matching functions is developed, and you want the new CMFs to apply not just to the white point but across the whole pipeline globally, then this kind of conversion becomes even more essential—for example, a fully-fledged Apple CMF 2026?
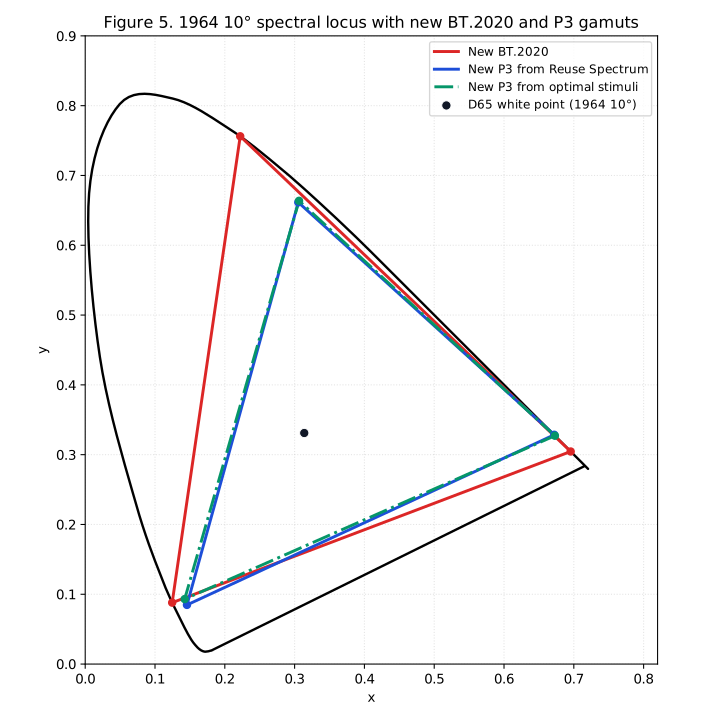
Depending on which bridge spectrum you choose, the conversion results will vary. For example, the solution constructed here from existing spectra produces a P3 under the 1964 10° CMFs whose blue region also extends beyond BT.2020, which isn’t quite consistent with the situation before the migration under the CIE 1931 2° CMFs.